
Chapter 12 of the NCERT Class 5 Math-Magic book is Smart Charts, a data-handling chapter that runs from textbook page 158 to page 169. It teaches you to record answers, read tables and draw charts using everyday things — pets, vehicles, TV ads and even rabbits.
The official Smart Charts Class 5 PDF is right below, and this page then walks through every activity and chart with its page number.
Download the Smart Charts Class 5 PDF
The official Smart Charts Class 5 PDF comes directly from the NCERT website and contains the whole chapter — every table, chart and activity on pages 158 to 169 — so you study from the official file, not a copy. Open it in any browser or PDF reader, or save it to your phone for revision.
Smart Charts Chapter 12 at a Glance
Smart Charts teaches data handling through everyday situations rather than a formal exercise block, so the book’s questions are built into each activity instead of collected at the end. The chapter-count table on this page shows how much of the chapter there is; the list below maps each activity to its textbook page.
- Yamini’s pet survey using tally marks (NCERT, p. 158-159)
- Sumita’s road vehicle count (NCERT, p. 160-161)
- Helping Hands and the chapati chart (NCERT, p. 162-163)
- Ad Mad (NCERT, p. 164)
- Hot and Cold bar charts (NCERT, p. 165)
- Rabbits in Australia (NCERT, p. 166)
- Family Tree (NCERT, p. 167)
- Growth Chart of a Plant (NCERT, p. 168-169)
What Smart Charts Class 5 Covers
The chapter builds one idea: data can be collected and shown in charts. Each activity adds a new chart skill to that idea.
- Yamini’s pet survey teaches you to make tally marks and find totals (NCERT, p. 159).
- Sumita’s road count teaches you to read a tally table and test a true-or-false statement (NCERT, p. 160).
- Helping Hands connects a survey total to a fraction of it (NCERT, p. 162).
- Ragini’s Ad Mad counts things that happen in time, like advertisements (NCERT, p. 164).
- Hot and Cold compares quantities using the height of bars (NCERT, p. 165).
- Rabbits in Australia uses a few numbers to approximate a trend (NCERT, p. 166).
- Family Tree reads generations in a drawing (NCERT, p. 167).
- The plant growth chart reads a dot’s position on two scales (NCERT, p. 168).
Key Concepts in Smart Charts
Every activity in the chapter is a way of turning answers into a picture. Keep that single idea in mind and the charts stop being separate topics.
Tally marks: counting in fives
One stroke records one answer. A second answer adds a second stroke, and when the fifth answer arrives its stroke is drawn across the other four, making a block that stands for 5 (NCERT, p. 158). Counting full blocks by fives is what makes a long list of answers quick to total.
Data tables: counts side by side
A data table stores the count for each item in its own row, so you can compare items at a glance and add the column for a total. Yamini’s pet table and Sumita’s vehicle table are both data tables (NCERT, p. 159-160) — the numbers that every chart in the chapter is made from.
The chapati chart: parts of a whole
A chapati chart is a circle chart. The whole circle stands for the total number of children, and each slice is one group’s fraction of that total. In Helping Hands the five answers add to 100 children, so each slice is a number out of 100 (NCERT, p. 162). The making-or-serving-food slice is 25 out of 100 — one fourth.
The bar chart: height shows quantity
A bar chart uses bars instead of slices: the taller the bar, the bigger the number. Two bars are compared by their heights, which is exactly what the Hot and Cold chart asks you to do for four cities on two dates (NCERT, p. 165).
The growth chart: one dot, two scales
A growth chart works differently because each dot carries two pieces of information: one scale gives the day and the other gives the height. The dot’s position is read against both scales (NCERT, p. 168).
Worked example: turning tally blocks into counts
Suppose 81 children are asked their favourite game and 23 choose cricket, 41 choose football and 17 choose kabaddi. Written as tally marks:
| Game | Tally marks written in fives | Count |
|---|---|---|
| Cricket | 4 full blocks of five, plus 3 single strokes | \(4 \times 5 + 3 = 23\) |
| Football | 8 full blocks of five, plus 1 single stroke | \(8 \times 5 + 1 = 41\) |
| Kabaddi | 3 full blocks of five, plus 2 single strokes | \(3 \times 5 + 2 = 17\) |
| Total | \(23 + 41 + 17 = 81\) |
Check any row by counting the full blocks, multiplying by 5 and adding the leftover strokes — the result must match the written number. That is exactly the check Yamini’s table asks you to do.
The growth chart method: subtract, then estimate
The fastest growth is found by subtracting heights, not by reading the biggest height. The chapter’s plant table gives heights on days 0, 4, 8, 12, 16 and 20; subtract each pair of heights:
| Interval | Growth in that interval |
|---|---|
| Day 0 to 4 | \(1.4 – 0 = 1.4\) cm |
| Day 4 to 8 | \(5.3 – 1.4 = 3.9\) cm |
| Day 8 to 12 | \(9.5 – 5.3 = 4.2\) cm |
| Day 12 to 16 | \(10.2 – 9.5 = 0.7\) cm |
| Day 16 to 20 | \(10.9 – 10.2 = 0.7\) cm |
The largest difference is 4.2 cm, between day 8 and day 12 — that is the period of fastest growth.
For the 14th day, do not jump to the nearest dot: day 14 sits between day 12 (9.5 cm) and day 16 (10.2 cm), so the height lies between them and 9.9 cm is the sensible choice.
The chart also shows growth slowing to 0.7 cm in the last two intervals, so the plant will not keep growing at the same pace forever — the book’s 100th-day question is a discussion, not a calculation.
The family tree: why generations double
A family tree is the chapter’s drawing-based chart, showing how relatives connect across generations (NCERT, p. 167). Every person has two parents, so each generation you go back doubles the number of elders: \(2, 4, 8, 16, 32, 64, 128\). That is why the seventh generation holds \(2^7 = 128\) elders. The chapter’s own questions then ask you to count names directly on the tree drawing, row by row.
Approximating a trend from a few numbers
Sometimes a chart’s job is a sensible guess, not an exact answer. The rabbit table gives 10, 18, 32, 58 and 108 rabbits from the start through year 4, and each number is a little less than double the one before — so year 5 is about 200 and year 6 about 400 (NCERT, p. 166). The approximation is the point.
Which chart to use when
The four chart types — the tally table, the chapati chart, the bar chart and the growth chart — each have a different job:
| Chart type | What it is best for | Where it appears |
|---|---|---|
| Tally table | Recording counts quickly as things happen, grouping marks in fives | Yamini’s pets (p. 158); Sumita’s road count (p. 160) |
| Chapati chart | Showing each group as a fraction of the whole total | Helping Hands (p. 162) |
| Bar chart | Comparing quantities by height, so the taller bar is the bigger number | Hot and Cold (p. 165) |
| Growth chart | Showing how a value changes over time, with each dot read on two scales | Growth Chart of a Plant (p. 168) |
Reading the Chapter’s Charts, Figure by Figure


Each pictured chart below is one the book asks you to read closely. The explanation says what to look at first and which error to avoid.
Yamini’s Tally Marks (NCERT page 159)
This is the chapter’s first chart and the one that introduces tally marks. Look first at the strokes next to each animal: some stand alone and some are grouped into five-stroke blocks. Each block is a group of five — four strokes with the fifth drawn across — so you count blocks by fives and add the leftovers.
The checking step is to multiply the number of full blocks by 5, add the leftover strokes and compare with the written number. The error to avoid is counting a full block as 4: the block already includes its fifth stroke. Cats is already filled in with 24 children, and the chapter asks you to complete the other rows (NCERT, p. 158-159).
Sumita’s Road Count (NCERT page 160)
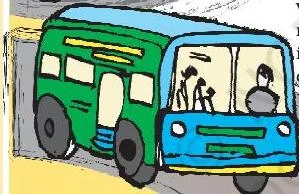
Sumita stood on the road for half an hour and made a tally mark for each vehicle that passed. Look first at the tally column and convert every row into a number, then add the column to find how many vehicles she saw altogether.
The figure also lets you test a statement: the book asks whether auto rickshaws are thrice the number of trucks. The figure shows 4 auto rickshaws and 1 truck, and thrice 1 is 3, not 4, so the statement is false. The error to avoid is deciding the true-or-false question before counting both rows.
The last task adds 7 buses and 2 trucks to the tally (NCERT, p. 160).
Helping Hands and the Chapati Chart (NCERT page 162)
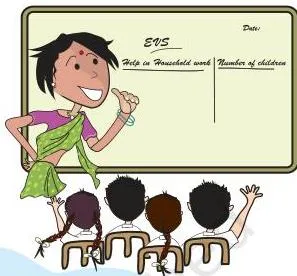
The EVS survey asked children which housework they help with most. Look first at the total: the five numbers 47, 15, 3, 25 and 10 add to 100, so the whole chapati chart stands for 100 children — and that is the fact the fraction question depends on.
The children who help in making or serving food are 25. Since 25 out of 100 is one fourth, the correct choice is one-fourth, not one-third or half (NCERT, p. 162). The error to avoid is judging the fraction before adding all five groups: the denominator comes from the whole total. This is the chapter’s own fraction check.
Ragini’s Ad Mad Count (NCERT page 164)
Ragini’s cartoon breaks are the chapter’s example of tallying things that happen in time, when you cannot pause real life to count. Each break had 14 advertisements, and in 10 of them children were the actors — which is why the book asks you to think about why children appear in so many ads.
The Try Yourself task adds a useful trick: put a dot below the tally whenever children appear in an advertisement, so one chart records two pieces of information at once. The error to avoid is trying to remember the children-ad count afterwards instead of recording it on the tally at the same time (NCERT, p. 164).
Hot and Cold: the Bar Chart (NCERT page 165)
The bar chart shows the highest temperature in four cities — Delhi, Shimla, Bangalore and Jaisalmer — on 1 June and 1 December. Look first at one date’s bars: on 1 June the tallest bar marks the hottest city, and on 1 December the shortest bar marks the coldest.
For the “little change” question, compare the two bars of each city: the city whose pair of bars is closest in height changed the least between June and December (NCERT, p. 165). The error to avoid is comparing bars across the two dates instead of within each date.
The chapter also suggests locating the cities on a map of India to connect temperature with climate.
Definitions You Need for Smart Charts
These are the names the chapter uses for the pictures it makes from data. Learn each name with its job, not as a separate fact.
| Term | Meaning | NCERT page |
|---|---|---|
| Tally marks | One stroke for each thing counted, with the fifth stroke drawn across the other four so a full block stands for 5 | p. 158 |
| Data table | A table that stores counts next to each item so numbers can be compared and totalled | p. 159-160 |
| Chapati chart | A circle chart in which the whole circle stands for the total and each slice is one group’s fraction | p. 162 |
| Bar chart | A chart in which the height of each bar shows the quantity, so taller means more | p. 165 |
| Growth chart | A chart with two scales in which each dot’s position shows a value at a point in time | p. 168 |
| Family tree | A drawing that shows how the people in a family are connected across generations | p. 167 |
Common Mistakes in Smart Charts
Every mistake in this chapter comes from rushing the reading, not from hard maths. Here are the five to watch for:
| Mistake | Correct rule | How to check your answer |
|---|---|---|
| Counting a tally block of five as 4 | A full block is 4 strokes with the fifth drawn across, so it stands for 5 | Count the full blocks, multiply by 5, add the leftover strokes and compare with the written number |
| Calling the making-or-serving-food slice one third | It is one fourth, because the total is 100, not 75 | Add all five answers first: \(47 + 15 + 3 + 25 + 10 = 100\); then 25 out of 100 is \(\frac{1}{4}\) |
| Choosing “double” for the rabbits | The rabbits grew to a little less than double each year | Compare each number with twice the previous one: \(18 \lt 2 \times 10\) and \(32 \lt 2 \times 18\) |
| Reading the wrong dot for the plant’s 14th day | Day 14 lies between day 12 and day 16, so estimate between those two dots | Read the two surrounding heights (9.5 cm and 10.2 cm) and pick a value between them — 9.9 cm |
| Comparing total heights when asked which period grew most | Subtract the heights to find the growth in each interval | The intervals give 1.4, 3.9, 4.2, 0.7 and 0.7 cm; the largest is 4.2 cm, from day 8 to day 12 |
Approximating the rabbit trend step by step. The book gives 10 rabbits at the start, then 18, 32, 58 and 108 in the first four years. Each number is a little less than double the one before, so year 5 is about 200 and year 6 is about 400 — that is why the chapter’s 400/600/800 choice is 400.
You can use the same pattern for the chapter’s rabbit double question: continue the doubling and the count is still below 1000 after year 7 but crosses 1000 in the eighth year.
How Smart Charts Is Usually Assessed
The chapter’s value is a skill, not a fact list: reading and making charts. For Class 5 that means five things:
- Converting tally marks into numbers and totalling a table (NCERT, p. 158-160)
- Comparing quantities by bar height (NCERT, p. 165)
- Estimating a missing value from a pattern, like the rabbits (NCERT, p. 166)
- Reading a dot between two dots on a growth chart (NCERT, p. 168)
- Explaining which part of a chapati chart is one fourth (NCERT, p. 162)
These are skills to practise, not promised questions. Textbook contents and the examinable syllabus are not always identical, so check the current official syllabus on cbse.gov.in to see what is examinable.
Smart Charts Quick Recap
The chapter does not close with a printed recap, so this one is in our words, in the order the chapter teaches.
- Tally marks group counts by 5 and are quick to total (p. 158).
- A data table stores counts side by side for easy comparison (p. 159-160).
- A chapati chart shows each group as a fraction of the whole total (p. 162).
- A bar chart compares quantities by height (p. 165).
- A growth chart shows change over time and needs its scale read carefully (p. 168).
- A few numbers can be used to guess a trend, like the rabbits’ a-little-less-than-double growth (p. 166).
Try Yourself Activities in Smart Charts
The chapter expects you to do these activities, not just read them — each one turns a chart skill into something real.
- Take a round in your colony, find out how many types of trees you can see, and use tally marks to note the different trees (p. 161).
- Next time you watch your favourite TV programme, count the advertisements in each break with tally marks, and put a dot below the tally whenever children appear in an advertisement (p. 164).
- On any one day, choose three cities, record their temperature from the TV or newspaper, and draw a bar chart; then ask your friends questions about it to see if they understand your chart (p. 165).
Related Resources for Class 5 Mathematics
This listing is maintained for the 2026-27 academic session using the NCERT textbook information available to us. NCERT remains the authority for confirming the latest edition.
Smart Charts is Chapter 12 of the Class 5 Math-Magic book, between Area and its Boundary (Chapter 11) and Ways to Multiply and Divide (Chapter 13). For revision help, start at the Class 5 Mathematics notes page or the main Class 5 notes page, and use the full index of CBSE notes to find any other class or subject.
The Class 5 Mathematics collection also includes a Grandmother’s Quilt page and a dedicated page for Ways to Multiply and Divide, the chapter that follows Smart Charts.
Sources and Data Verification
- All page references and figure captions describe the NCERT Class 5 Mathematics book (Math-Magic), Chapter 12 Smart Charts, pages 158-169, in the official edition published on ncert.nic.in.
- This page covers that one chapter. Other chapters of Math-Magic and other Class 5 subjects have their own pages and are not described here.
- This listing is maintained for the current academic session against the NCERT edition published on ncert.nic.in.
- NCERT settles textbook content, editions and official PDFs; CBSE settles the curriculum, syllabus and examinations. A textbook chapter and the examinable syllabus are not always identical.
| What the chapter holds | Count | Where it is used |
|---|---|---|
| Printed pages | 11 | |
| Figures with NCERT captions | 5 | |
| Tables | 6 | |
| Official NCERT PDF | Download the chapter PDF | the chapter exactly as NCERT publishes it |
Smart Charts Class 5 FAQs
Short answers to the questions students search for most.
What is a tally mark in Smart Charts Class 5?
A tally mark is one stroke you make for each answer or thing you count. When the fifth answer comes, its stroke is drawn across the other four, so a full block stands for 5 and the total is counted in groups of five (NCERT, p. 158).
What is a chapati chart in Class 5 Smart Charts?
A chapati chart is a circle chart. The whole circle stands for the total number of children and each slice is one group’s fraction of that total. In Helping Hands the five answers add to 100 children, and the making-or-serving-food slice is 25 out of 100 — one fourth of the chart (NCERT, p. 162).
Why did the rabbits in Australia grow so fast in Smart Charts?
Rabbits were brought to Australia around 1780, and no animals there ate them, so nothing kept their numbers down. The table shows them growing to a little less than double every year — 10, 18, 32, 58, 108 — which is why the chapter says to imagine what they did to the crops (NCERT, p. 166).
How do I guess the plant’s height on the 14th day in Smart Charts?
Look at the dots on either side of day 14: day 12 is 9.5 cm and day 16 is 10.2 cm. Since day 14 lies between them, its height is between 9.5 and 10.2 cm, so of the chapter’s options, 9.9 cm is the sensible guess (NCERT, p. 168-169).
Which chart should I use: tally marks, bar chart or growth chart?
Use tally marks when you are recording things as they happen, such as vehicles on a road or advertisements in a break (p. 160, 164). Use a bar chart when you want to compare quantities, such as the temperatures of cities (p. 165). Use a growth chart when you want to show change over time, such as a plant’s height (p. 168).
Where are the Try Yourself activities in Chapter 12 Smart Charts?
There are three: count the types of trees in your colony with tally marks (p. 161); count advertisements in a TV break and put a dot under the tally when children appear in an advertisement (p. 164); and record one day’s temperatures for three cities and draw a bar chart (p. 165).
Reference: NCERT Class 5 Mathematics textbook, chapter 12, official edition on ncert.nic.in.
Explore Class 5 Mathematics Books
- Previous: Grandmother's Quilt
- Next: Ways to Multiply and Divide
Related chapters: