Looking for the data handling class 2 chapter? It is Chapter 11 of NCERT’s Joyful Mathematics for Class 2 — a 16-page, activity-led chapter on counting pictures, making tables and charts, and comparing amounts. The official NCERT PDF is right below; after it, a plain-language walkthrough of every activity in the chapter.
Download the Data Handling Class 2 chapter PDF
The file below is the official chapter as published by NCERT on ncert.nic.in — the same pages students use in class. Open it to read along, or save it for offline practice.
Download the Data Handling Class 2 NCERT chapter PDF — official Joyful Mathematics Chapter 11, 16 pages.
Data Handling chapter at a glance
The table below shows how much the chapter holds in one glance — its sections, activities, charts and recording tables.
| What the chapter holds | Count | Where it is used |
|---|---|---|
| Printed pages | 16 | |
| Figures with NCERT captions | 6 | |
| Tables | 8 | |
| Activities | 4 | |
| Official NCERT PDF | Download the chapter PDF | the chapter exactly as NCERT publishes it |
A glance does not show the chapter’s shape. This is an activity-led chapter: four Let us Do tasks, two surveys that ask friends questions, a project carried out with nearby families, and a closing run of puzzles — with no numbered exercise set at the end.
What the chapter covers, start to finish
Use this map to find any activity fast. Each one follows the same pattern — collect, record, compare — so once the child can do one, the rest are variations. In the order they appear:
- Let us Do — favourite colours: children look at a picture of classmates, count children by colour (red, green, blue, yellow), fill a table, then answer which colour is most liked, least liked, liked more than green, and liked less than another colour.
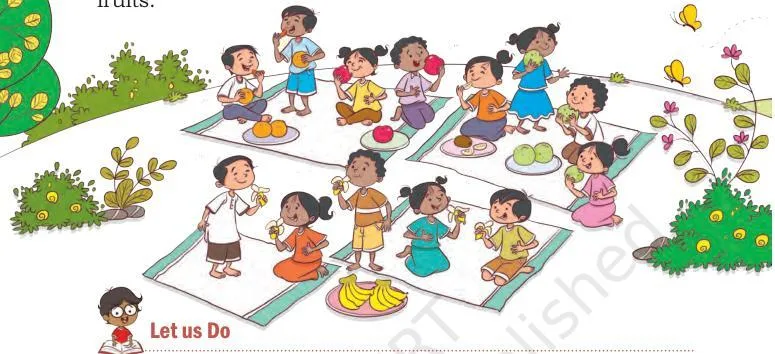
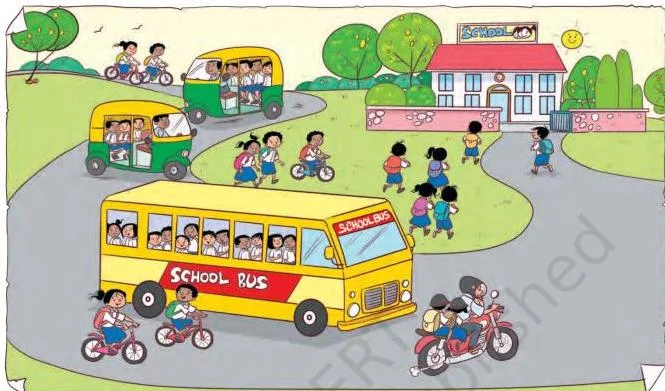
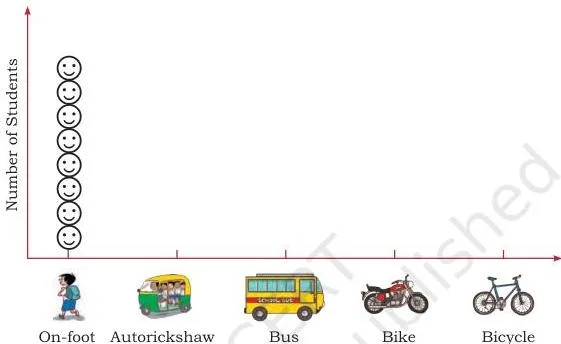
- Picnic Day — fruit party: children count how many classmates like each fruit (apple, banana, orange, guava, kiwi), compare fruit counts using more than, less than or equal to, then record how classmates come to school and draw a smiley chart (NCERT, Picnic Day).
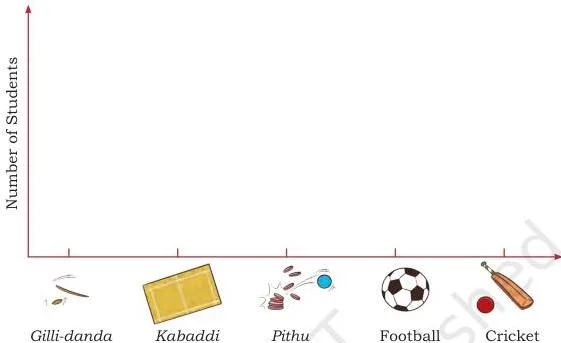
- Let us Do — games we play: a picture of children playing games including Pithu and football is counted into a table, turned into a smiley chart, and read back for most and least liked games; then a class survey asks friends which vegetables they like most.
- Ask your friends — family members: each child asks friends how many people live in their homes, fills a families-by-size table, and answers how many families have 4 people, more than 4 people, and so on.
- Project Work — grandparents: children visit nearby families and record whether grandparents live with them (detail below).
- Puzzles: a mixed set of number and shape challenges that practise the same careful counting (detail below).
The project work: visiting nearby families
Project Work takes data collection out of the book and into the real world — the child asks actual families a question and records their answers (NCERT, Project Work).
- The question: do grandparents live with your family?
- The four answers: both grandparents, only female grandparents, only male grandparents, or no grandparents.
- The record: one tally in the table for each family visited, under the correct column.
- The follow-up: how many families were visited, how many live with both grandparents, how many live with one grandparent (only female or only male), and how many live without grandparents.
The book asks children to discuss the questions in class before visiting, so everyone asks the same question the same way — that is what makes the collected data fair to compare.
Why the chapter ends with puzzles
The closing puzzle pages look unrelated to tables and charts, but they train the same mental muscles: looking carefully, counting, comparing and checking. The puzzles mix several kinds of challenge (NCERT, Puzzles):
- connecting similar shapes without crossing or diagonal lines;
- completing patterns and identifying shadow images;
- a word search for the number names eleven to twenty;
- counting paths for an ant returning to its anthill and a cat returning home;
- matchstick squares and a “who am I?” riddle about a wheel’s shape;
- arranging the numbers 1 to 7 so three arms have the same total, and a calculator-key puzzle;
- a “think of a number” trick — worked below.
The think-of-a-number trick, worked. The steps are: think of a number, double it, add 8, subtract half of that result, then subtract the number you started with. Try it with 7:
- Think of a number: \(7\).
- Double it: \(14\).
- Add 8: \(22\).
- Half of 22 is \(11\); \(22 – 11 = 11\).
- Subtract the starting number: \(11 – 7 = 4\).
Why it is always 4: with any starting number \(n\), doubling and adding 8 gives \(2n + 8\), and half of that is \(n + 4\). Subtracting that half and then the original number cancels \(n\) completely:
\[ (2n + 8) – (n + 4) – n = 4 \]
No matter which number the child starts with, the answer stays 4 — a first taste of algebra hidden inside a Class 2 game.
The key ideas in the chapter’s activities
Data handling in Class 2 means turning a messy picture or a set of answers into organised counts that can be compared. The chapter repeats five moves, and every activity is one of them:
- Count from a picture — count one category at a time: children per colour, per fruit, per game.
- Record counts in a table — write each count in its row so numbers can be compared without re-counting.
- Draw a chart — one smiley face per person turns a table of numbers into a picture.
- Read the chart back — answer questions from the picture you made.
- Compare with words — most liked, least liked, more than, less than, equal to.
Here are the chapter’s recording formats, and where each one appears (NCERT, Chapter 11):
| Recording format | What it looks like | Where it appears |
|---|---|---|
| Picture count | Counting each category straight from a picture | Favourite colours; fruit party; games children play |
| Table | Category names with a number for each | Colours, fruits, vegetables, family members |
| Face chart | One smiley (☺) per person, in rows | Modes of coming to school; games |
| Project survey | Asking real families a question and tallying answers | Grandparents living with families |
How the picture activities work
Picture activities look easy and hide one trap: the answer must come from the counted table, not from a quick glance at the picture. Here is the routine the chapter expects, then three activities walked through.
Step-by-step method for most liked and least liked questions:
- Count one category in the picture, touching each item once.
- Write that count in the table.
- Repeat for every category.
- Find the largest number — that category is most liked; the smallest is least liked.
- For a comparison blank, test the sentence aloud before writing.
Favourite colours, worked. Suppose the counts come out: red 5, green 3, blue 4, yellow 2.
- Most liked: red (5, the largest count).
- Least liked: yellow (2, the smallest count).
- Red (5) is liked more than blue (4).
- Blue (4) is liked more than green (3), and green (3) is liked more than yellow (2).
The book’s own blanks are answered the same way — count every colour first, then compare the numbers. So a blank like “yellow is liked more than ___” is solved by finding a colour whose count is smaller than yellow’s.
Fruit party, worked. Now the compare step with all three phrases. Suppose the fruit counts are: banana 6, apple 4, orange 5, kiwi 5, guava 2.
- Banana (6) vs apple (4): \(6 \gt 4\), so banana is liked more than apple.
- Orange (5) vs kiwi (5): \(5 = 5\), so orange is liked equal to kiwi.
- Guava (2) vs apple (4): \(2 \lt 4\), so guava is liked less than apple.
Total children in the fruit-party picture: \(6 + 4 + 5 + 5 + 2 = 22\). Each blank in the book reads the same way: name the two categories, compare their numbers, pick the correct phrase.
Coming to school, worked. Here the table is already filled with counts — say bus 9, autorickshaw 6, bicycle 4, bike 2, with empty rows for other modes. The child draws one smiley per student (☺ = 1 student), so bus gets 9 smileys, autorickshaw 6, and so on. Reading the finished chart: most students come by bus, least by bike, and bus (9) is more than autorickshaw (6).
Words and definitions the chapter uses
The chapter does not print a glossary, so these are working definitions for discussion, tied to the activities — not printed NCERT definitions.
| Term | Plain meaning | Example from the chapter |
|---|---|---|
| Data | Information collected by counting or asking | Favourite colours of classmates; modes of coming to school |
| Table | A grid that organises counts into rows and columns | Colour table; fruit table; family-size table |
| Chart | A picture display of counts, such as smiley faces | Smiley chart for modes of coming to school |
| Most liked | The category with the largest count | “The most liked colour is ___” |
| Least liked | The category with the smallest count | “The least liked fruit is ___” |
| More than | A larger count than the other category | More children like bananas than apples |
| Less than | A smaller count than the other category | Fewer children like guava than apples |
| Equal to | Exactly the same count in both categories | Same number of children for oranges and kiwis |
Common mistakes in Data Handling activities
Each error below comes from a specific blank in the chapter. Naming it before the child meets it usually prevents it.
| Mistake | Correct rule | How to check your answer |
|---|---|---|
| Picking the most liked colour by looking at the picture, not the table | Count each category first; the largest number wins | Point to the biggest number in the table — that category is the answer |
| Writing a number where the blank asks for a category name | If the sentence asks “which colour/fruit/game”, write a name; write a number only where the sentence asks “how many” | Read the sentence aloud — a sentence ending in “is ___” wants a name |
| Forgetting that one smiley equals exactly one student | Draw one smiley (☺) per person counted | Count the smileys in a row and compare with the table count — they must match |
| Filling comparison blanks backwards, such as “Yellow is liked more than ___” | The blank holds the category with the smaller count, because yellow is the one being compared | Say the finished sentence aloud; if it sounds false, swap the comparison word or the category |
| Comparing the wrong rows in the family-members table | Compare matching rows only: families with 4 people against families with 5 people, never against the “1 person” row | Read the row label aloud before comparing |
Skills to practise before moving on
Use this as a ten-minute check after the chapter — a parent can work through it without re-reading the book. The child should be able to:
- count a picture accurately, one category at a time, and enter the counts in a table;
- turn a table into a one-to-one smiley chart (one smiley per person);
- read a finished chart back, naming the longest and shortest rows;
- answer most liked and least liked questions from the counted numbers;
- answer more than, less than and equal to comparisons;
- attempt the logical puzzles — patterns, paths, shapes and the number trick.
One honest note: textbook contents and the examinable syllabus are not always identical — check the current official syllabus for Class 2 before assuming this chapter is examinable this session.
Data Handling in one paragraph
Data handling means collecting information, organising it, and comparing it. In Class 2 the information comes from two places: counting a picture and asking people questions. A table keeps the counts in one place, and a smiley chart shows them as pictures, one smiley per item.
Comparison words — most liked, least liked, more than, less than, equal to — describe how the counts relate. The puzzles at the end are not decoration: they sharpen the careful counting and number sense that reading charts quietly depends on.
Related chapters and resources
This listing is maintained for the 2026-27 academic session using the NCERT textbook information available to us. NCERT remains the authority for confirming the latest edition.
Move around the same class and book with these links:
- Class 2 study notes hub — all Class 2 subjects in one place;
- Class 2 Mathematics notes — the Joyful Mathematics chapter pages;
- How Much Did Rupal Spend? — the chapter that comes before Data Handling in the book;
- CBSE notes home — study notes for other classes and subjects.
The official chapter file is the NCERT PDF at ncert.nic.in, linked in the download section above.
Sources and data verification
This page describes NCERT Class 2 Mathematics (Joyful Mathematics), Chapter 11 Data Handling, in its official edition as published on ncert.nic.in. The PDF linked above is the official NCERT chapter file.
This page covers that one NCERT chapter — not the CBSE curriculum, which is larger and includes optional and skill subjects this page does not index. It is maintained for the current academic session using the NCERT information available to us.
NCERT settles textbook editions and PDFs; CBSE settles curriculum, syllabus and examinations.
Reference: NCERT Class 2 Mathematics (Joyful Mathematics) textbook, chapter 11, official edition on ncert.nic.in.
Frequently asked questions
What is data handling for a Class 2 child?
Data handling is collecting information, organising it, and comparing it. In this chapter a child does it by counting a picture — favourite colours, fruits, games — and by asking friends questions — favourite vegetables, family members — then recording the answers in a table or chart.
How does the smiley chart in Class 2 Data Handling work?
Each smiley face stands for exactly one person. If the table says 9 students come by bus, the bus row gets 9 smileys. The finished chart shows which row is longest (most) and shortest (least) without re-counting.
Why do the more than and less than questions confuse children?
Because the blank does not tell you which side is bigger. In “Yellow is liked more than ___”, the blank wants a colour with fewer votes than yellow. The fix is to read the sentence aloud with a candidate answer; if it sounds wrong, flip it.
Why does the think of a number trick always end at 4?
Because the steps cancel out the starting number. Doubling and adding 8 gives \(2n + 8\); half of that is \(n + 4\); subtracting \(n\) leaves 4, whatever number was chosen.
Is Chapter 11 Data Handling part of the Class 2 exam syllabus?
This chapter is in the NCERT textbook, but textbook contents and the examinable syllabus are not always identical — check the current official syllabus for Class 2. This page makes no claim about what the exam includes.
Explore Class 2 Mathematics Books
Related chapters: