
Looking for the Work in Human Services Class 8 chapter PDF? You are in the right place — this is Chapter 5 of the NCERT Kaushal Bodh vocational-education textbook, and the official file is linked below.
The chapter’s Project 5 is a Water Audit for Water Management, and everything under the download explains that project in plain language — the data skills, the measurements, the comparisons and the repairs — so you can do the fieldwork with the book open.
Download the Class 8 Kaushal Bodh Work in Human Services PDF
Open the Class 8 Kaushal Bodh Work in Human Services chapter PDF on the official NCERT textbook portal to read the chapter exactly as published — the English edition of this Grade 8 vocational-education project, straight from the source.
If you already have the book open, the explanations below still earn their place — they translate each activity into a clear next step and show every calculation fully worked out.
Chapter at a glance
The table below shows what the chapter file contains — its pages, sections, figures and tables — so you know what you are opening before you download.
By content type, this is a project workbook, not a theory lesson. It opens with a short introduction to human services — serving people and working with them in different ways — then presents one project choice: Project 5, the Water Audit for Water Management, or a project you design yourself with your teacher.
Everything that follows builds the audit. Eight numbered activities take you from measuring a tap’s flow to estimating a hostel’s future water demand.
Sample data-collection forms and spreadsheet tables show how to record and calculate; two “Reflect on your learnings” sets check your understanding; and a closing “Think and Answer” page connects the project to your locality and to real jobs.
Work in Human Services Class 8: what the chapter covers
Human services means serving people and interacting with them in different ways (NCERT, p. 106). The book’s projects in this area teach you how to work with people — taking care of health, making videos, budgeting for a family, even applying mehndi or developing a comic book.
The chapter’s structure is simple: you take up only one project. Two complete examples are given — Water Audit for Water Management and Creating Advertisements — or you can design your own with your teacher (p. 108). The rest of Chapter 5 is the water audit, so that is where this page spends its time.
Why water? India holds only about 4 per cent of the world’s freshwater but nearly 18 per cent of its population — and that water is not spread evenly. Some places flood while others face drought (p. 110).
The book is blunt about the cause: droughts are mainly human-made, through deforestation, poor farming, over-extraction of groundwater, and mismanagement at the household and district level. One example it gives — a tap left running for five minutes wastes 45 litres (p. 110).
The project’s arc, once you choose it:
- Prepare with data literacy — primary data from your own survey, secondary data from official records (p. 112).
- Measure — tap flows, bucket capacities, utensil volumes, all converted to litres (pp. 113-114).
- Collect — a household survey, an interview with a water-supply official, and a neighbourhood map (pp. 116-118).
- Compare — your measured average against official norms and against the rainwater your district receives (pp. 122-125).
- Act — fix leaking taps, restrict flow, reuse greywater, recharge groundwater (pp. 125-131).
The book also lists five ways water availability can be increased: planting trees, reducing pollution to raise rainfall, reducing wastage, recycling water, and conservation methods like rainwater harvesting (p. 125).
By the end you should be able to do four things (p. 111): measure and calculate water availability, usage and wastage; collect data on availability and consumption trends; analyse and compare water-usage data; and identify and implement practical ways to reduce wastage.
Key concepts you need before starting
These are the working ideas of the project. A student who cannot tell primary data from secondary data, or litres from cubic metres, will get stuck in Activity 1 — so read this section before you start the fieldwork.
Assemble the materials first. The book’s checklist (p. 111) is short: a notebook and pen, a measuring reference (a 1 L bottle replaces the measuring jar), a bucket and mug, basic plumbing tools, a stopwatch or timer, a survey form, a calculator, and a computer with spreadsheet software.
Primary and secondary data
Every activity in the audit uses one of two kinds of data, and the two are collected differently and trusted differently (NCERT, p. 112).
Primary data is collected first-hand — through surveys, experiments, interviews and observations. In this project, the ten-family household survey of Activity 3 is your primary data. Secondary data comes from other reliable sources — population figures from government websites, water bodies from government reports, a village’s area from a government office.
The audit needs both: primary data for what people actually consume, secondary data for what the locality actually receives. Label every entry as one or the other while collecting, and you will never mix them up later.
Measuring water: units and flow rate
You cannot audit water until you can say how much of it there is, so the project starts with units and a way to measure a tap (NCERT, pp. 113-114).
- Millilitres (\( \text{mL} \)) for small quantities; litres (\( \text{L} \)) for household use; cubic metres (\( \text{m}^3 \)) for municipal supply and storage tanks.
- One cubic metre equals 1,000 litres: \( 1\ \text{m}^3 = 1000\ \text{L} \).
- Flow rate is the water a tap or shower delivers per minute, measured in litres per minute (\( \text{L/min} \)).
To measure a tap’s flow rate: let it run into a bucket for exactly one minute, then measure the water collected. If the bucket has no printed capacity, measure it with a utensil of known capacity — the book’s example is a 1 L bottle (p. 114).
The consumption formula the whole project runs on:
\[ \text{Amount of water used} = \text{flow rate}\ (\text{L/min}) \times \text{time tap is kept ON}\ (\text{min}) \]
Worked example. A tap flowing at \( 8\ \text{L/min} \) is kept open for 12 minutes while utensils are washed:
Step 1: Write down the flow rate and the time.
Flow rate \( = 8\ \text{L/min} \); time ON \( = 12\ \text{min} \).
\[ \text{Water used} = 8\ \text{L/min} \times 12\ \text{min} \]
\[ = 96\ \text{L} \]
Final answer: the activity used 96 litres of water.
The minutes cancel, so the answer comes out in litres. Always record the result in litres only — the book is explicit: “All the data is to be recorded in litres only” (p. 121).
Where the water comes from
An audit has to know not just how much water a household uses, but where that water comes from and how many people share it (NCERT, pp. 115-117). Rainwater reaches us through rivers, wells, borewells and tanks, is stored in dams, and travels through canals and pipelines.
The book’s first “Reflect on your learnings” set asks three things: the storage capacity of your locality’s tank, the daily supply, and how many people use that water (pp. 115-116). You can calculate a tank’s capacity from the dimensions marked on it — work out the volume, then convert to litres.
For supply figures, the book sends you to the municipal corporation, Gram Panchayat office or water-supply authority. Activity 2 then builds a seven-question interview with a water-supply official, ending with a simple neighbourhood map of wells, tanks and delivery points (pp. 116-118).
Rainwater availability per person
Activity 4 compares what you measured with what nature actually supplies — using official records, not your own counting (NCERT, pp. 122-124). This is secondary data, so every figure must carry a source and a year.
The calculation chain has three steps:
- Total rainfall volume = area \( (\text{m}^2) \times \) rainfall \( (\text{m}) \). Because \( 1\ \text{km}^2 = 10^6\ \text{m}^2 \), a district measured in square kilometres must be converted first.
- Convert cubic metres to litres: \( 1\ \text{m}^3 = 1000\ \text{L} \).
- Split the total: roughly 70 per cent of rainwater goes to agriculture, 20 per cent to industry, 10 per cent to domestic use. Per capita availability = domestic share ÷ population.
Worked example. Suppose a district of \( 2000\ \text{km}^2 \) receives \( 0.5\ \text{m} \) of rain in a year:
Step 1: Convert the area to square metres.
\( 2000\ \text{km}^2 = 2000 \times 10^6\ \text{m}^2 \).
\[ \text{Volume} = 2000 \times 10^6\ \text{m}^2 \times 0.5\ \text{m} = 1000 \times 10^6\ \text{m}^3 \]
Step 2: Convert to litres.
\[ 1000 \times 10^6\ \text{m}^3 \times 1000\ \text{L/m}^3 = 10^{12}\ \text{L} \]
Step 3: Take the domestic share — 10 per cent.
\[ 0.1 \times 10^{12}\ \text{L} = 10^{11}\ \text{L} \]
Step 4: Divide by the population — say \( 500{,}000 \) people.
\[ \frac{10^{11}\ \text{L}}{5 \times 10^5} = 2 \times 10^5\ \text{L/person/year} = 200{,}000\ \text{L/person/year} \]
\[ \frac{200{,}000}{365} \approx 548\ \text{L/person/day} \]
Final answer: about 548 litres per person per day of rainwater is available for domestic use on average.
The book adds an honest warning: a district-level calculation is not an accurate picture, because rainwater flows into rivers and the whole population of the river basin — from origin to sea — depends on that water (p. 124).
Greywater and the reed bed
Most of the water you use does not vanish — it comes back as wastewater, and this chapter treats that wastewater as a resource (NCERT, pp. 129-131).
Greywater is the wastewater generated from domestic sources: sinks, baths, washing machines and kitchens. Instead of letting it drain away, the book offers two reuse paths:
- Direct reuse: leftover water from washing vegetables or cooking can water the kitchen garden — just avoid water that is too soapy (p. 130).
- Reed bed system: greywater is collected in a sedimentation tank, where suspended particles settle; the water then passes through the roots of water-loving plants such as Canna indica and Colocasia, which absorb organic pollutants and heavy metals (pp. 130-131).
This is natural filtration, modelled on how rivers clean themselves — weeds absorb minerals, oxygen decomposes organic matter, and sunlight kills bacteria. Greywater can also be used for flushing toilets (p. 130).
Groundwater recharge
Storing water underground beats storing it on the surface because evaporation losses are minimal — and groundwater levels are dropping alarmingly from uncontrolled extraction (NCERT, pp. 127-129).
Three community methods, and the job each one does:
| Method | What it does | Where it is described |
|---|---|---|
| Contour bunds | Earth bunds built along contour lines hold rainwater at the same level on a slope, so it stays in the field instead of running off; this also reduces soil erosion. | pp. 128-129 |
| Check dam | A small dam built on a water stream slows the speed of runoff, so water lingers and can irrigate fields. | pp. 128-129 |
| Percolation tank | A tank (or dam, or borewell recharge) lets rainwater percolate slowly into the ground, refilling groundwater. | pp. 128-129 |
Contours are lines connecting points of equal elevation; earth bunds laid “on contour lines hold the water at the same level” (p. 128), which is why they work on slopes.
The figures in this chapter, explained
The chapter teaches through pictures. Each figure below is one the project actually uses — keep your book open beside this page and read the explanation with the diagram, so the picture does its job.
The audit and the data it runs on
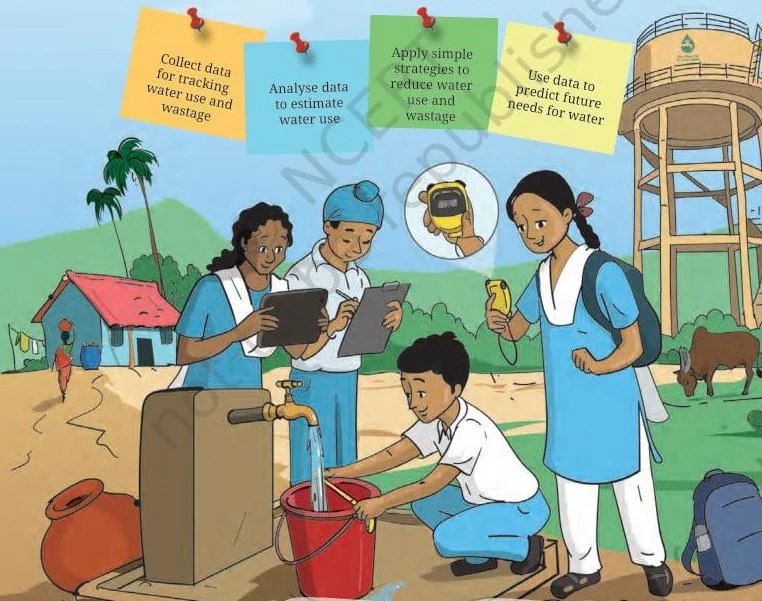
This is what the whole project looks like on the ground: going house to house, talking to people, and recording their answers. It is the method behind Activity 3’s survey of ten families — you are the person in this picture.
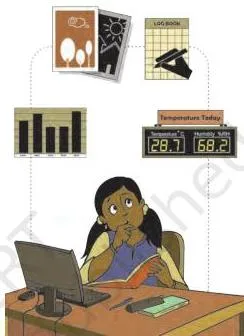
Figure 5.2 sets up the entire project: data is not just numbers. Facts, figures, photographs and videos all count as data once they are collected for a purpose.
The book’s weather example shows why this matters — the meteorological department predicts monsoons and cyclones from past data, and farmers can delay sowing or choose crops that need less water on the strength of that forecast (pp. 109-110).
Measuring water in daily life
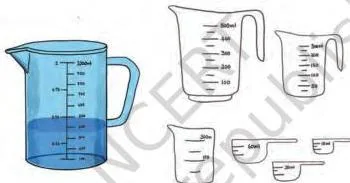
These are the science-lab tools that measure water precisely — and that nobody wants to carry around a kitchen. That is why the project replaces them with buckets, bottles and mugs whose capacity is known: a 1 L bottle becomes your measuring reference, and every observation is converted to litres (pp. 113-114).
Storage, supply and sources
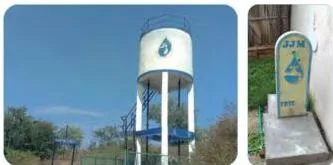
Storage and supply are two separate things the audit must account for. Tank capacity can be calculated from the dimensions printed on the tank; the daily supply figure comes from the water-supply officer. Both numbers feed the first “Reflect on your learnings” set (pp. 115-116).
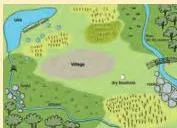
This is the map Activity 2 asks you to create after interviewing the water-supply official. Knowing where your water comes from — and how much population depends on it — is necessary for the audit (pp. 116-117).
Appliance facts as data
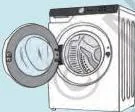
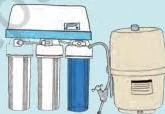
The “Did you know?” callout teaches that appliance manuals are a legitimate data source: a washing machine consumes roughly 70 L per cycle, and an RO filter wastes about 3 L for every 1 L it treats (p. 119). Your survey form asks families about exactly these appliances.
Finding and fixing wastage
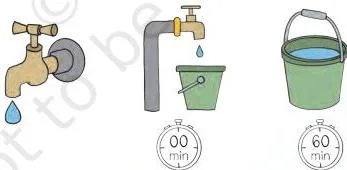
Activity 6’s measurement method is in this picture: start the stopwatch when the waste starts, stop it when it ends, note the duration, repeat, and calculate the volume collected in the bucket (p. 126).

Leaks often need only minor repairs, and the book walks you through the six steps (pp. 126-127). The order matters, and the safety step comes first:
- Turn the water mains off before starting any work.
- Remove the tap’s handle — take off the cover under the hot/cold sign, undo the screw, and lift the handle off.
- Unscrew the tap bonnet and remove the headgear; the body washer, o-ring and jumper valve should come out.
- Replace the washer, o-ring and jumper valve with new parts; apply tap lubricant for a smoother seal.
- Refit the bonnet and spindle without over-tightening the nuts.
- Put the tap back together, turn the water back on, and check that it no longer leaks.
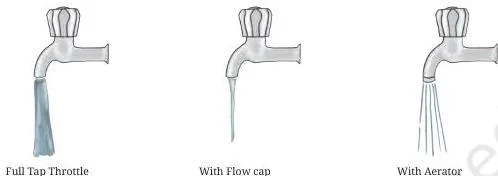
Most of us open taps at full throttle out of habit. A flow cap or aerator restricts the flow per minute, or you can simply open the tap partially — the same jobs get done with less water (p. 127).
Recharging groundwater
The three recharge figures below match the three principles — hold the water, slow the runoff, let it percolate (pp. 128-129).
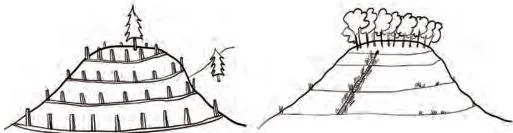
The bunds are earth ridges laid along contour lines — lines joining points of equal elevation — so water cannot run straight down the slope.
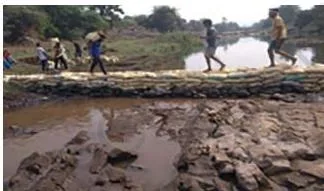
The check dam’s job is to cut the speed of runoff, giving the water time to soak in or be drawn for irrigation.
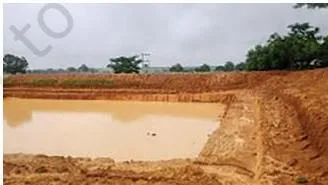
The percolation tank exists for one purpose: letting water seep underground, where evaporation losses are minimal. Dams and borewell recharge work on the same idea.
Reusing water
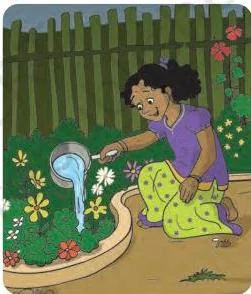
The simplest greywater reuse takes no equipment: runoff from washing vegetables or cooking waters the kitchen garden. Keep it from being too soapy, and it is safe for plants (p. 130).
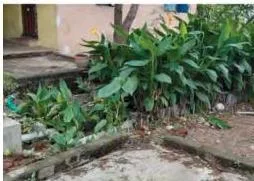
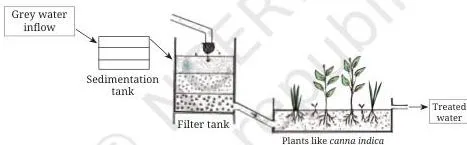
Figures 5.15 and 5.16 together show the complete natural filtration sequence: greywater enters a sedimentation tank where suspended particles settle, then moves through the roots of plants like Canna indica and Colocasia, which absorb organic pollutants and heavy metals (pp. 130-131). A school can build one of these for its own wastewater.
Definitions: the terms that keep coming back
These are the words the activities and reflect prompts keep using. Knowing them before the fieldwork saves you most of the confusion.
| Term | Meaning in plain words | NCERT page |
|---|---|---|
| Human services | Serving people and interacting with them in different ways — the field this chapter’s projects train you for. | p. 106 |
| Water audit | A systematic examination of water usage and wastage within a building or household. | p. 108 |
| Primary data | Information you collect first-hand, through surveys, experiments, interviews or observations. | p. 112 |
| Secondary data | Information obtained from reliable outside sources — government websites, reports, offices. | p. 112 |
| Flow rate | How much water a tap or shower delivers in one minute, in litres per minute. | p. 114 |
| Per capita availability | The share of water per person — the domestic rainwater share divided by the population. | pp. 123-124 |
| Greywater | Domestic wastewater from sinks, baths, washing machines and kitchens. | p. 129 |
| Groundwater recharge | Helping rainwater percolate into the ground to refill depleted groundwater. | p. 127 |
| Sedimentation tank | The first tank in a reed bed system, where suspended particles settle before water moves on. | p. 130 |
Common mistakes in the water audit project
The book warns against several errors in passing — here they are, named before you make them.
| Mistake | Why it happens | Correct rule and how to check |
|---|---|---|
| Mixing up primary and secondary data | Both types appear in the same project, and neither is labelled as it is collected. | Surveys, interviews and observations you do yourself are primary; government reports and websites are secondary. Label every entry in your notebook at collection time (p. 112). |
| Not converting everything to litres | Cubic metres, millimetres of rainfall and bucket counts look fine in a table until you compare them. | Multiply \( \text{m}^3 \) by 1000, turn millimetres into metres, and count buckets as litres. The book records everything in litres only (pp. 113, 121). |
| Treating non-numeric observations as data | “The tap drips often” feels like useful information, but it cannot be tabulated or averaged. | Only numbers can go into the spreadsheet. The book calls this maintaining the integrity of the data — accurate, reliable and consistent (pp. 120-121). |
| Unreliable collection | Two students counting the same thing get different answers because nobody fixed the rule first. | Define the counting rule before you start — the book’s example is deciding which colour counts as “red”. Data must be correct, reliable, and from a trusted source (pp. 109-110). |
| Using secondary data without a source or year | Data changes over time — population and rainfall figures move every year. | Name the report, the publisher and the year so a reader can verify it. The book’s own model cites a Press Information Bureau release dated 14 August 2024 for the Jal Jeevan Mission norm (p. 124). |
| Unsafe or unpermitted fieldwork | Enthusiasm beats preparation when the survey starts. | Take permission before entering any home, stay careful around slippery areas and water sources, and avoid working in extreme heat (p. 112). |
| Comparing without a baseline | Average consumption alone means nothing until it is set against a standard. | Activity 5 compares your measured average with the prescribed usage: 55 L per person per day for rural areas and 135 L for urban areas under the Jal Jeevan Mission (pp. 124-125). Check the current norm on the Ministry of Jal Shakti website before finalising. |
What the project asks you to produce
Know the finish line before you start. The book promises four outcomes (p. 111):
- Measure and calculate water availability, usage and wastage.
- Collect data on total water availability and trends in consumption.
- Analyse and compare water-usage data.
- Identify and implement practical ways to reduce wastage.
The book does not print marks or weightage for these tasks — treat the checklist below as the project’s requirements, not as exam weightage. Each deliverable lives on a specific page:
| Deliverable | What it must contain | Chapter location |
|---|---|---|
| First “Reflect on your learnings” | Storage capacity of your locality’s tank, daily supply, population served. | pp. 115-116 |
| Activity 2 interview record | Seven answered questions plus your neighbourhood water-source map. | pp. 116-118 |
| Activity 3 household survey | At least ten families, tabulated in a spreadsheet or notebook, with the average consumption per person. | pp. 118-121 |
| Activity 4 secondary-data table | Population, area and rainfall of your district, each with its source and year referenced. | pp. 122-124 |
| Activity 5 comparison table | Your measured average against the prescribed usage norm. | pp. 124-125 |
| Activity 6 wastage record | Locations and types of leaks found, measured wastage, and the repairs done. | pp. 125-127 |
| Activity 7 water-reuse record | Which reuse method you tried and the water it saved. | pp. 129-131 |
| Second “Reflect on your learnings” | Initiative taken, activity details, estimated litres saved per day. | pp. 130-131 |
| Activity 8 future-demand estimates | Two scenarios: a 100-home society and a 1,000-student hostel. | pp. 131-132 |
| “What did I learn from others?” + timeline | Surprising finding, three water-saving lessons, hours spent per activity. | p. 132 |
| “What else can I do?” | Extensions: programming an estimator, writing to officials, other audits, solar water tanks. | p. 133 |
| “Think and Answer” | Project reflection, the river-mapping task, and jobs related to the work (environmental scientist, environmental engineer, industry professional, social worker, auditor). | p. 133 |
Revision summary: the audit in eight steps
The chapter has no printed summary block, so here is the whole project as one connected sequence. If you can tick all eight, you have covered the chapter.
- Understand the challenge — India’s water scarcity; droughts are mainly human-made (p. 110).
- Learn the tools — units, flow rate, and the formula amount = flow × time (pp. 113-114).
- Know your locality — tank capacity, daily supply, population, water sources (pp. 115-117).
- Collect primary data — the ten-family household survey, recorded in litres (pp. 118-121).
- Collect secondary data — rainfall, area and population from reliable sources, with references (pp. 122-124).
- Compare — your measured average against the prescribed usage of 55 L (rural) or 135 L (urban) per person per day (pp. 124-125).
- Act — fix leaking taps, fit aerators, reuse greywater, recharge groundwater (pp. 125-131).
- Plan ahead — estimate future demand for the two scenarios and reflect on what you learned (pp. 131-133).
The whole project is a loop — measure, compare, act, reflect — and every activity feeds the next.
Related resources
If you are moving through the Kaushal Bodh book in order, the Class 8 Kaushal Bodh Project 4 page covers the previous chapter and the Class 8 Kaushal Bodh Project 6 page the next one.
For the rest of the book, see the Class 8 Kaushal Bodh book page, and for everything else in this class, the Class 8 NCERT books hub. The wider CBSE notes collection covers the academic subjects alongside this vocational project.
This chapter appears in the English edition of Kaushal Bodh. Textbook contents and the examinable syllabus are not always identical — check the current official syllabus for the vocational-education scheme before deciding what is examinable.
Sources and data verification
- The page numbers and figure captions on this page describe the NCERT Kaushal Bodh textbook for Grade 8 (vocational education), English edition, chapter 5 “Work in Human Services”, pages 106-133, Reprint 2026-27.
- This page covers that one chapter of the Kaushal Bodh book. It does not cover the full CBSE vocational-education scheme.
- This listing is maintained for the current session (2026-27) using the NCERT information available to us.
- NCERT settles textbook content, editions and official PDFs; CBSE settles curriculum, syllabus and examinations.
| What the chapter holds | Count | Where it is used |
|---|---|---|
| Printed pages | 28 | |
| Figures with NCERT captions | 26 | |
| Tables | 8 | |
| Official NCERT PDF | Download the chapter PDF | the chapter exactly as NCERT publishes it |



Reference: NCERT Class 8 Kaushal Bodh textbook, chapter 5, official edition on ncert.nic.in.
FAQs on Class 8 Work in Human Services
What is the Work in Human Services chapter in Class 8 Kaushal Bodh about?
It is Chapter 5 of the Grade 8 vocational-education book. Human services means serving people and interacting with them in different ways (p. 106). You choose one project — the chapter’s worked example is Project 5, the Water Audit for Water Management: a systematic examination of water usage and wastage in a building or household using data that is collected and analysed (p. 108).
What is the difference between primary data and secondary data in the water audit project?
Primary data is collected first-hand — your ten-family survey, interviews and observations are all primary (p. 112). Secondary data comes from reliable outside sources — population from government websites, rainfall from official reports (p. 112). The audit uses primary data for consumption and secondary data for availability.
How do I measure a tap’s water flow in litres per minute?
Let the tap flow into a bucket for exactly one minute, then measure the water collected — that amount is the flow rate in litres per minute (p. 114). If the bucket has no printed capacity, measure it with a known reference such as a 1 L bottle (p. 114). Then use the formula: amount used = flow rate × time the tap is ON.
Worked example: a tap at \( 8\ \text{L/min} \) open for 12 minutes uses \( 8 \times 12 = 96\ \text{L} \).
How much water does a washing machine or an RO filter use?
A washing machine consumes roughly 70 L per cycle, and an RO water filter wastes about 3 L for every 1 L of treated water (p. 119). The book presents these as “Did you know?” facts and suggests checking the manufacturer’s website for exact figures.
What is greywater and how can it be reused at home or school?
Greywater is the wastewater generated from domestic sources — sinks, baths, washing machines and kitchens (p. 129).
Reuse options in the chapter: pour leftover washing or cooking water on plants (p. 130), use greywater for flushing toilets (p. 130), or build a reed bed system — a sedimentation tank followed by the roots of plants like Canna indica and Colocasia, which absorb pollutants and heavy metals (pp. 130-131).
How is the rainwater available in my district calculated?
Multiply the district’s area in square metres by the rainfall in metres to get the total volume in cubic metres, convert to litres (\( 1\ \text{m}^3 = 1000\ \text{L} \)), take 10 per cent as the domestic share, and divide by the population (pp. 122-124). Roughly 70 per cent of rainwater goes to agriculture, 20 per cent to industry, and 10 per cent to domestic use (p. 123).
Explore Class 8 Vocational Education Books
Related chapters: