
This page gives you the Introduction to Linear Polynomials Class 9 chapter — Chapter 2 of the NCERT Class 9 Mathematics textbook, Ganita Manjari (Part I). The chapter runs across printed pages 17-40 of the official edition, and the PDF is right below.
Download the Introduction to Linear Polynomials Class 9 PDF
The official file holds the whole chapter — the six numbered sections, every exercise set, all diagrams and the end-of-chapter summary. Get the Introduction to Linear Polynomials Class 9 PDF straight from NCERT’s textbook portal whenever you want the full chapter in a single clean file.
Chapter 2 at a Glance: What Is Inside the File
The file is organised as one continuous chapter that moves from definitions to graphs, then closes with exercises and a summary.
| Section | What it does |
|---|---|
| 2.1 Introduction | Revises algebraic expressions, terms, coefficients and variables through pen-and-pencil and garden-cost examples. |
| 2.2 Linear Polynomials | Defines degree, introduces linear and constant polynomials, builds linear equations, and presents the input-output idea. |
| 2.3 Exploring Linear Patterns | Finds expressions for square tiles, pocket money and auto fare, all based on a constant difference. |
| 2.4 Linear Growth and Linear Decay | Applies the same constant-change idea to quantities that increase or decrease over time. |
| 2.5 Linear Relationships | Finds y = ax + b from two data points and interprets the two numbers. |
| 2.6 Visualising Linear Relationships | Plots straight lines, names the slope and y-intercept, and compares families of lines. |
| End-of-chapter exercises and summary | Mixed questions, including starred problems, followed by the chapter summary. |
What This Chapter Covers: From Algebraic Expressions to Straight Lines
One question runs through the chapter: which real-life situations produce expressions whose highest power is 1, and what do those expressions look like when graphed?
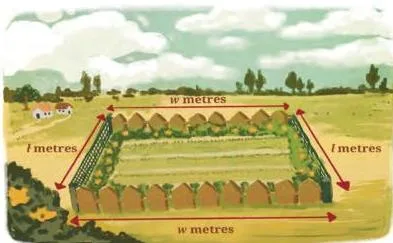
The starting point is revision. Example 1 turns sealed boxes of pens and pencils into \(4x + 5y + 3\). Example 2 turns a rectangular garden into \(200l + 160w + 50lw\); the garden picture below is the first figure of the chapter.

The book then narrows to one variable. A polynomial’s degree is the highest power of that variable, and degree 1 earns the name linear. Tile patterns, pocket money and auto fares all turn out to fit degree-1 expressions.
The final section plots every expression \(y = ax + b\) as a straight line and names its two numbers: the slope \(a\) and the y-intercept \(b\).
Notice the recurring device: a situation is converted into an expression or equation, and the numbers in the situation become the numbers in the expression.
- pens in boxes: \(4x + 5y + 3\);
- garden fencing and seeds: \(200l + 160w + 50lw\);
- chess club fees: \(200 + 50m\);
- square tiles: \(2n – 1\);
- pocket money: \(100 – 5n\);
- auto fare: \(15n – 5\); plant growth and phone depreciation in the exercises follow the same shape.
Key Concepts That Hold This Chapter Together
Everything in this chapter rests on one observation: when a quantity changes by the same amount at every step, its expression is linear and its graph is a straight line.
What Makes a Polynomial Linear
This section fixes the language the exercises use. Once you can name the degree, coefficients and constant term of a polynomial, the rest of the chapter is that idea applied.
In Example 1, \(4x\), \(5y\) and 3 are terms; 4 and 5 are coefficients; 3 is a constant. Letters such as \(x\) and \(y\) are now called variables (NCERT p. 17).
The book then restricts attention to one variable and defines the degree as the highest power of that variable (NCERT p. 18).
- degree 3 — cubic, e.g. \(5y^3 + y^2 + 2y – 1\);
- degree 2 — quadratic, e.g. \(x^2 + 5x + 1\);
- degree 1 — linear, e.g. \(3z + 7\);
- degree 0 — constant, e.g. 8, because \(8 = 8x^0\).
So \(3z + 7\) is a linear polynomial and \(x^2 + 5x + 1\) is not. Exercise Set 2.1 (p. 19) asks exactly these judgements: the degrees of four polynomials, the coefficients hiding in terms that look missing, and constant terms.
Linear Patterns: The Constant Difference
A pattern is linear when consecutive values change by the same amount at every step. This constant difference is the single idea the whole chapter builds on.
The square-tile pattern in Fig 2.4 starts with 1, 3, 5, 7 tiles; each stage adds 2 tiles. The nth stage therefore has \(2n – 1\) tiles (NCERT pp. 22-23). Example 7 uses pocket money: starting with Rs 100 and spending Rs 5 daily gives \(100 – 5n\) rupees left on the nth day (p. 23).
Example 8 is an auto fare: Rs 25 for the first 2 km and then Rs 15 per km gives \(25 + 15(n-2) = 15n – 5\) rupees for n at least 2 (p. 24).
A linear pattern is a sequence in which the difference between consecutive terms is constant. That constant difference is exactly what the graph’s slope becomes later in the chapter.
Linear Growth and Linear Decay
Growth and decay are the same constant-change idea with the sign flipped.
Example 9 models a journey cost as \(C(d) = 100 + 60d\): the cost rises by Rs 60 for every kilometre, so it is linear growth (NCERT pp. 24-25). Example 10 models water level as \(h(t) = 3 – 0.5t\): the height falls by 0.5 m every month, so it is linear decay (p. 25).
Exercise Set 2.4 gives four situations — a growing plant, a depreciating phone, a growing village population and a prepaid balance — and each asks three things: build the expression, make the table, and explain why it represents growth or decay. That explanation is the point of the section, not the arithmetic.
The Linear Relationship y = ax + b and Its Two Numbers
Two data points are enough to decide the two numbers \(a\) and \(b\). The method has four steps: substitute both pairs into \(y = ax + b\), isolate \(b\) from one equation, substitute into the other, and solve.
Here is a fresh worked example with different numbers from the book.
Step 1: Two monthly bills are given: 5 GB of data costs Rs 210 and 8 GB costs Rs 300.
\[ 210 = 5a + b \]
\[ 300 = 8a + b \]
Step 2: Isolate \(b\) from the first equation.
\[ b = 210 – 5a \]
Step 3: Substitute into the second equation and solve for \(a\).
\[ 300 = 8a + (210 – 5a) = 3a + 210 \]
\[ 90 = 3a \]
\[ a = 30 \]
Step 4: Substitute \(a = 30\) back to find \(b\).
\[ b = 210 – 5(30) = 60 \]
Final answer: \(y = 30x + 60\), so the charge is Rs 30 per GB and the fixed monthly fee is Rs 60.
In NCERT’s own telecom example, the Think and Reflect on page 27 asks what 20 and 150 in \(y = 20x + 150\) mean: 20 is the cost per GB and 150 is the fixed monthly fee. In the graph section, a will be renamed the slope and b the y-intercept.
How to Read the Graphs in This Chapter
The graphs are where the chapter becomes concrete. Work through them in order and the symbols stop being abstract.
Fig 2.3: A Polynomial as an Input-Output Machine
This diagram gives you the first picture of a function: a value of \(x\) goes in, and the value of \(2x + 3\) comes out.
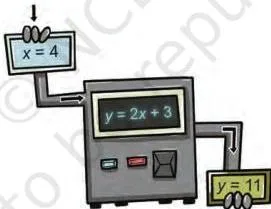
Feeding \(x = 4\) into the machine gives \(2 \times 4 + 3 = 11\); feeding \(x = -6\) gives \(2 \times (-6) + 3 = -9\) (NCERT p. 21). Contrast this with \(10x – x^2\) from Example 3, which is quadratic because the output depends on \(x^2\).
Fig 2.4: The Tiles That Produce y = 2x – 1
This figure lets you see the pattern before the formula.
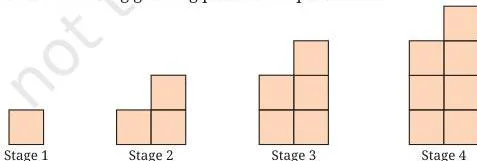
Each new stage adds two tiles, one on each side: stage 1 has 1 tile, stage 2 has 3, stage 3 has 5. Since the number of tiles is twice the stage number minus 1, the rule is \(2n – 1\) (NCERT pp. 22-23). The constant difference 2 is the slope of the corresponding line.
Figs 2.5 and 2.6: Two Points Are Enough to Draw a Line
Both figures show the plotting procedure: find two points, plot them, join them, and extend the line.
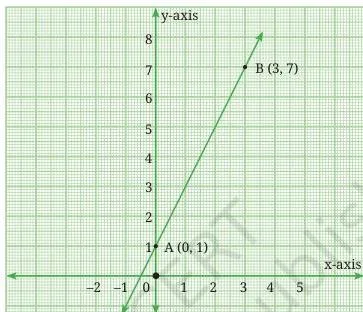
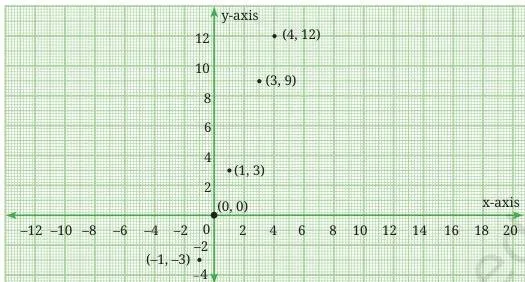
For \(y = 2x + 1\), the points A(0, 1) and B(3, 7) determine the line, which then extends both ways (NCERT p. 28). For the five points in Fig 2.6, every y-coordinate is three times its x-coordinate, so the equation is \(y = 3x\) (p. 29). The check: a point lies on a line exactly when its coordinates satisfy the equation, so (7, 15) lies on \(y = 2x + 1\) because 15 = 2(7) + 1.
Fig 2.7: What a Negative Slope Looks Like
Here the same procedure produces a line that slants down instead of up.
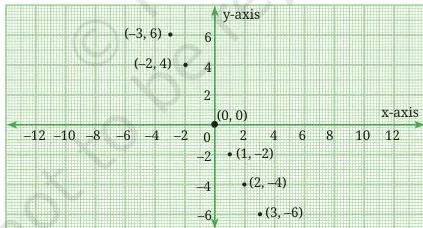
The points (-3, 6), (-2, 4), (0, 0), (1, -2), (2, -4), (3, -6) from Example 13 all satisfy \(y = -2x\) (NCERT pp. 29-30). Each y-coordinate is -2 times its x-coordinate, so as x increases, y decreases. That is the graphical meaning of linear decay.
Figs 2.8 and 2.11: How ‘a’ Controls the Steepness
These two figures are the same experiment for positive and negative slopes.
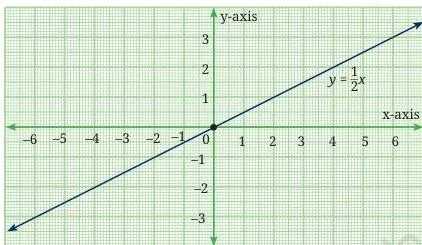
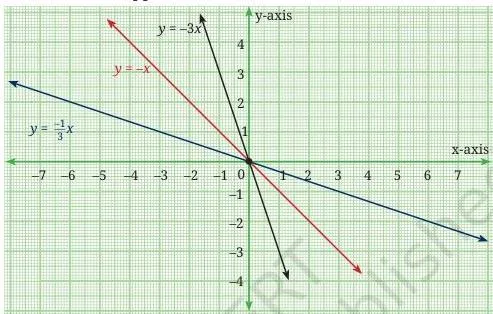
Every line of the form \(y = ax\) passes through the origin (0, 0). When a is greater than 1, the line is steeper than \(y = x\); when a lies between 0 and 1, the line is flatter (NCERT p. 32). The negative family \(y = -\frac{1}{3}x\), \(y = -x\), \(y = -3x\) mirrors below the x-axis and gets steeper as a moves away from 0.
The number a is called the slope.
Figs 2.12A and 2.14: Reading the y-Intercept
The final piece of \(y = ax + b\) is the number b, which fixes where the line crosses the y-axis.
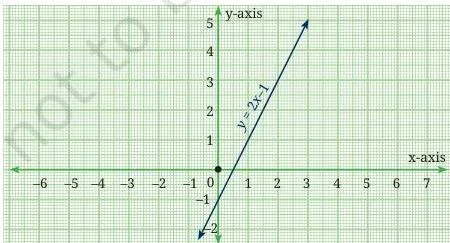
Fig 2.12A draws one member of a family alone, \(y = 2x – 1\). Changing only b gives \(y = 2x + 1\) and \(y = 2x + 5\): same slope, different crossing points, so the three lines are parallel (NCERT p. 36).
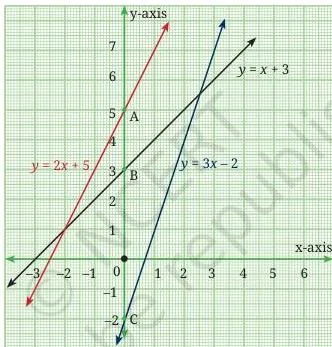
Fig 2.14 shows \(y = x + 3\), \(y = 2x + 5\) and \(y = 3x – 2\) cutting the y-axis at (0, 3), (0, 5) and (0, -2). Every line \(y = ax + b\) cuts the y-axis at \((0, b)\); a negative b means the cut lies below the origin (NCERT p. 36). The number b is the y-intercept.
Definitions: The Exact Words That Matter Here
Most of the new language arrives in Section 2.1 and in the last section. These are the words the exercises use, so it is worth knowing them exactly.
| Term | Meaning | NCERT page |
|---|---|---|
| Algebraic expression | Combination of numbers, variables and operation signs, such as \(4x + 5y + 3\). | p. 17 |
| Term | A part of an expression separated by + or -; \(4x\), \(5y\) and 3 are terms. | p. 17 |
| Coefficient | The number multiplying a variable in a term; 4 and 5 in \(4x + 5y + 3\). | p. 17 |
| Constant | A term with no variable, such as 3. | p. 17 |
| Variable | A letter that stands for a changing quantity; the chapter now uses this word instead of letter-number. | p. 17 |
| Univariate polynomial | An algebraic expression in exactly one variable, such as \(3z + 7\). | p. 18 |
| Degree | The highest power of the variable in a polynomial. | p. 18 |
| Linear polynomial | A polynomial of degree 1, such as \(2x + 3\). | p. 18 |
| Constant polynomial | A polynomial of degree 0, such as 8 written as \(8x^0\). | p. 18 |
| Linear equation | A linear polynomial set equal to a constant, such as \(2x + 10 = 64\). | p. 20 |
| Function | A rule that gives one output for each input; \(2x + 3\) is a function of x. | p. 21 |
| Linear pattern | A sequence of numbers whose consecutive terms differ by the same constant. | p. 24 |
| Linear growth | A pattern in which a quantity increases by a constant amount over equal intervals. | p. 25 |
| Linear decay | A pattern in which a quantity decreases by a constant amount over equal intervals. | p. 25 |
| Linear relationship | A relation between two variables written as \(y = ax + b\). | p. 26 |
| Slope | The number a in \(y = ax + b\), which measures how steep the line is. | p. 32 |
| y-intercept | The number b in \(y = ax + b\); the line cuts the y-axis at (0, b). | p. 36 |
Common Mistakes in This Chapter, and How to Fix Each
These are traps the exercise sets deliberately test. Read each row before attempting the questions.
| Mistake | Correct rule | How to check your answer |
|---|---|---|
| Saying the coefficient of z in \(4z^3 + 5z^2 – 11\) does not exist. | The z term is missing, so the coefficient is 0: \(4z^3 + 5z^2 + 0z – 11\). | Rewrite the polynomial with 0z and read the coefficient. |
| Calling the constant 8 a degree-1 polynomial. | 8 is degree 0 because \(8 = 8x^0\). | Write the term as \(8x^0\) and check the highest power. |
| Confusing a linear polynomial with a linear equation. | \(2x + 10\) is a polynomial; \(2x + 10 = 64\) is the equation made from it. | An equation has an equals sign and a right-hand side; a polynomial does not. |
| Reading \(y = 20x + 150\) as Rs 20 fixed and Rs 150 per GB. | a = 20 is the charge per GB; b = 150 is the fixed monthly fee. | Put x = 0; b is the value when the variable is zero. |
| Using \(15n – 5\) for a 1-km ride. | The expression is valid only for n at least 2, because the first 2 km share the flat Rs 25. | Check n = 1: the fare is Rs 25, but 15 – 5 = 10, so the rule applies only later. |
| Reading a negative slope as no growth. | A negative slope means constant decrease, which is linear decay. | Compare the table values: heights 3, 2.5, 2 fall by 0.5 each step. |
| Thinking different intercepts means lines are not parallel. | Lines with equal slopes and different y-intercepts are parallel. | Compare the a values; if they match, the lines never meet. |
Exam Pointers: What the Exercises Prepare You For
The book’s own exercises train five kinds of task. Match your revision to these.
| Task family | Exercise set | What a full answer should include |
|---|---|---|
| State the degree and read coefficients and constant terms | Exercise Set 2.1 | Name the degree with its word (constant, linear, quadratic, cubic) and state each coefficient, including 0 for a missing term. |
| Evaluate a polynomial at given values | Exercise Set 2.2 Q1-2 | Substitute each value carefully; keep negative signs, e.g. \(7(-3)^2 – 4(-3) + 6\). |
| Turn a word problem into a linear expression or equation and solve it | Exercise Sets 2.2 and 2.3 | Define the variable first, translate each statement, form the equation, solve, and state the unit in the answer. |
| Find a and b in y = ax + b from two data points | Exercise Set 2.5, including the Celsius-Fahrenheit question | Write two equations, isolate b, substitute, solve, and check both original pairs. |
| Draw graphs and identify slope, y-intercept and parallel lines | Exercise Set 2.6 and the starred end-of-chapter questions | Plot two true points, join and extend; read (0, b) on the y-axis; compare slopes to test whether lines are parallel. |
One caution: textbook contents and the examinable syllabus are not always identical — check the current official syllabus before deciding what to revise.
The Chapter Summary, Rebuilt for Quick Recall
This is the NCERT chapter summary turned into a scanning list.
- An algebraic expression combines numbers, variables and operation signs; its parts are terms with coefficients.
- A univariate polynomial has one variable; its degree is the highest power of that variable.
- Degree 1 is linear; degree 0 is constant.
- Equating a linear polynomial to a constant produces a linear equation.
- A linear pattern is a sequence with a constant difference between consecutive terms.
- Linear growth increases by a fixed amount over equal intervals; linear decay decreases by a fixed amount.
- A linear relationship between x and y is \(y = ax + b\); a is the slope and b is the y-intercept.
- Every line \(y = ax + b\) cuts the y-axis at (0, b); when b = 0, the line passes through the origin.
- Positive slope means growth; negative slope means decay.
- Parallel lines have the same slope a and different y-intercepts b.
Related Pages on This Site
Continue from this chapter to the full book, the hub, or the neighbouring chapters.
- NCERT Class 9 Mathematics book — the book page this chapter belongs to.
- Class 9 NCERT books hub — the Class 9 books in one place.
- Previous chapter: The World of Numbers
- Next chapter: Orienting Yourself — The Use of Coordinates
- Class 9 Mathematics revision notes
- Class 9 notes hub
- CBSE notes index
- Notes on The World of Numbers
- Notes on Orienting Yourself: The Use of Coordinates
Sources and Data Verification
This listing is maintained for the 2026-27 academic session using the NCERT textbook information available to us. NCERT remains the authority for confirming the latest edition.
The chapter contents and figures described on this page come from the NCERT Class 9 Mathematics textbook, Ganita Manjari (Part I), Chapter 2, Introduction to Linear Polynomials, official edition on ncert.nic.in.
This page covers the Class 9 Mathematics Part I book only. Other Class 9 subjects and the Part II book are described on their own pages.
The listing is maintained for the current session using the NCERT information available to us. NCERT settles textbooks, editions and PDFs; CBSE settles the curriculum, syllabus and examinations — see the CBSE website for the official syllabus.
| What the chapter holds | Count | Where it is used |
|---|---|---|
| Printed pages | 25 | |
| Sections in the chapter | 5 | |
| Figures with NCERT captions | 11 | |
| Tables | 8 | |
| Exercise questions | 25 | answered in our NCERT Solutions |
| Official NCERT PDF | Download the chapter PDF | the chapter exactly as NCERT publishes it |
Reference: NCERT Class 9 Mathematics textbook, chapter 2, official edition on ncert.nic.in.
Frequently Asked Questions About This Chapter
What is a linear polynomial?
A linear polynomial is a polynomial of degree 1, so the highest power of the variable is 1. In one variable it has the form \(ax + b\) where a is not zero — for example \(3z + 7\) or \(2x – 1\) (NCERT p. 18).
What is the difference between a linear polynomial and a linear equation?
A linear polynomial is an expression such as \(2x + 10\). When the polynomial is equated to a constant, you get a linear equation, such as \(2x + 10 = 64\) from Example 6 (NCERT p. 20).
What is the difference between linear growth and linear decay?
Linear growth is a constant increase over equal intervals, like \(C(d) = 100 + 60d\). Linear decay is a constant decrease, like \(h(t) = 3 – 0.5t\). Both have the same structure; only the sign of the change differs (NCERT p. 25).
How do you find the slope and y-intercept from y = ax + b?
In \(y = ax + b\), a is the slope and b is the y-intercept. The line cuts the y-axis at (0, b); if b is negative, the cut lies below the origin (NCERT p. 36).
When are two lines parallel?
Two lines are parallel when they have equal slopes a but different y-intercepts b, for example \(y = 2x – 1\) and \(y = 2x + 5\). Equal slopes with changing b shift the line but never tilt it (NCERT p. 36).
What does the input-output machine in Fig 2.3 show?
The diagram shows the linear expression \(2x + 3\) as a rule: a value of x goes in and the value of \(2x + 3\) comes out.
Feeding \(x = 4\) gives \(2 \times 4 + 3 = 11\); feeding \(x = -6\) gives \(2 \times (-6) + 3 = -9\). This is the chapter’s first picture of a function (NCERT p. 21).
Explore Class 9 Mathematics Books
- Previous: Orienting Yourself: The Use of Coordinates
- Next: The World of Numbers
Related chapters:
- Exploring Algebraic Identities
- I'm Up and Down, and Round and Round
- Measuring Space: Perimeter and Area